Sound Analysis
|
Bridge Tap Sound
|


Using the Spectra Viewer: At least one violin and one view must be checked to see spectra images. Multiple instruments or views can be displayed for comparisons.
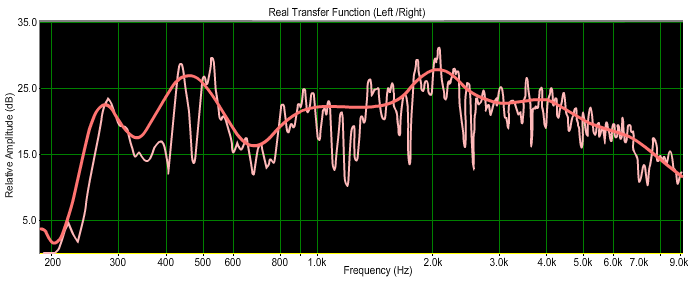
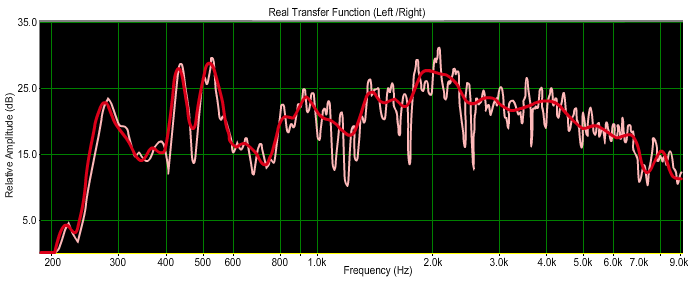
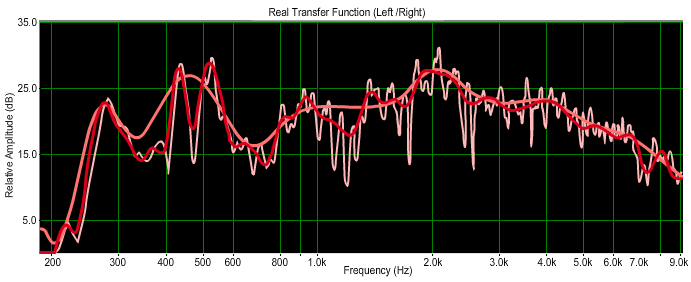
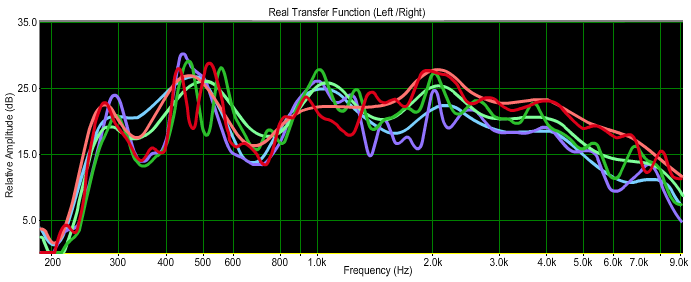
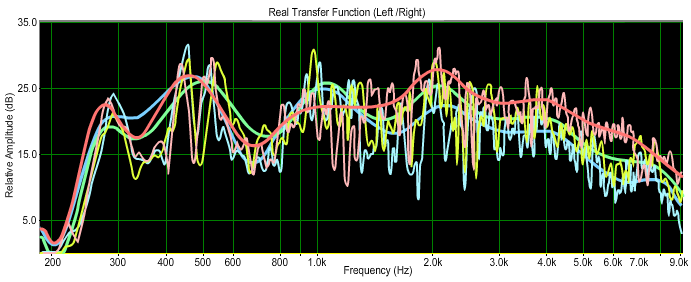
The Display Views: The Spectra here were processed in a choice of three views:
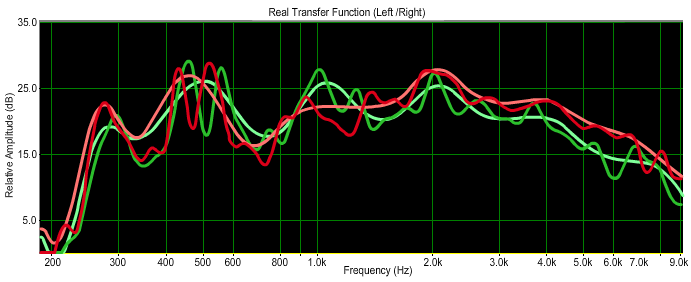
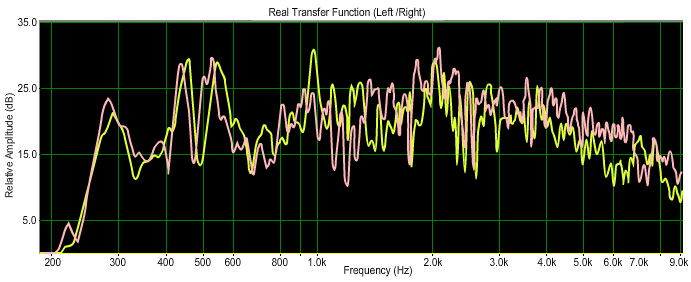
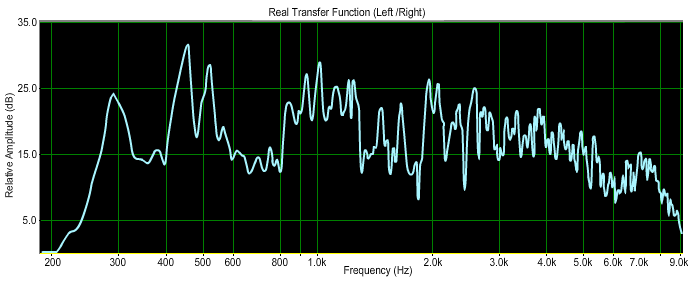
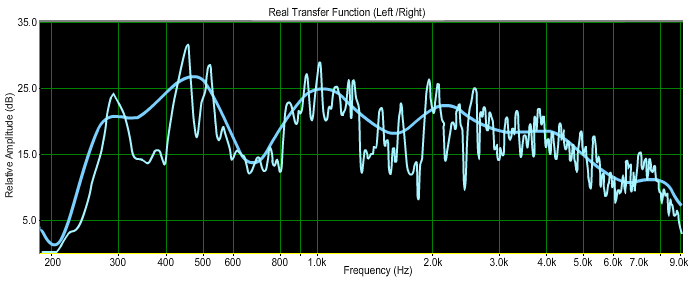
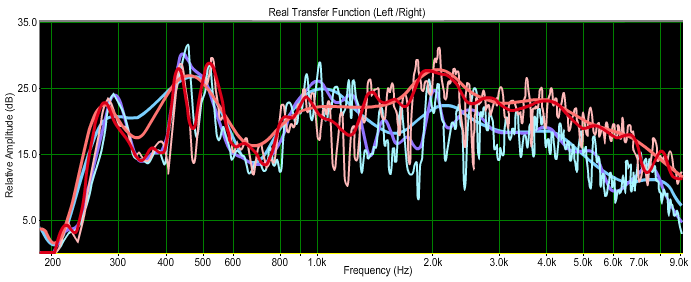
- Detail, which shows individual resonance peaks.
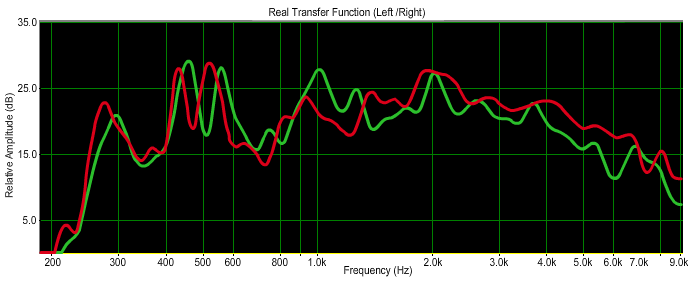
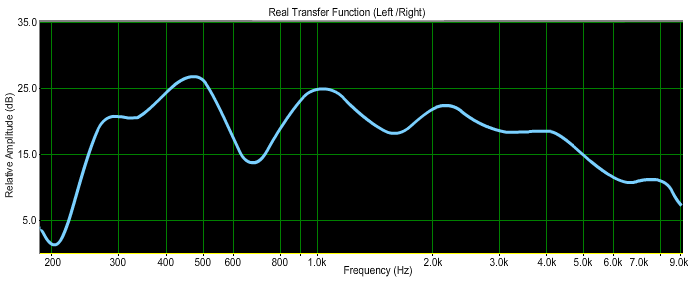
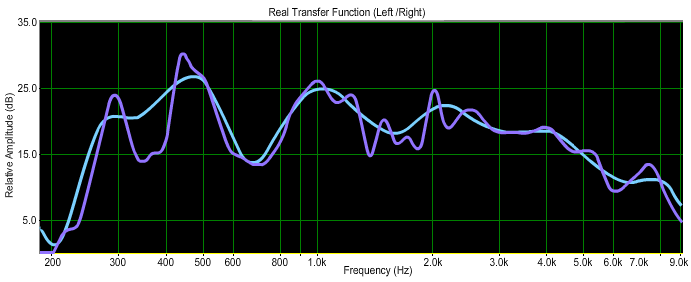
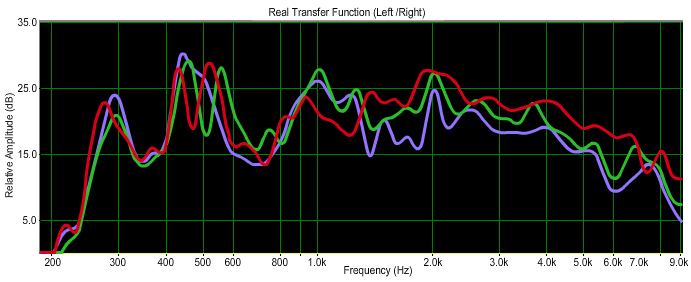
- 1/9 Octave, smoothed for ease of visual comparison.
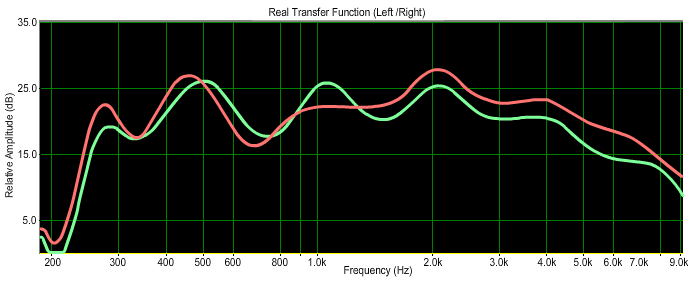
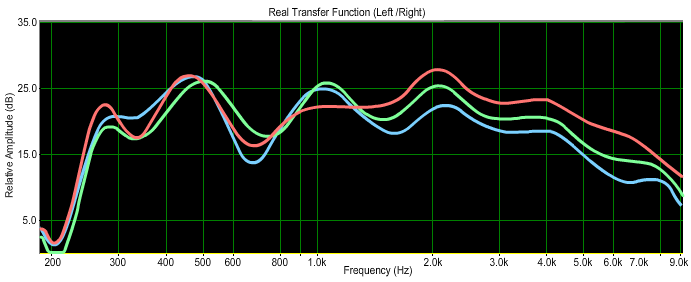
- 1/3 Octave, smoothed in larger sections; showing less detail, but revealing overall trends.
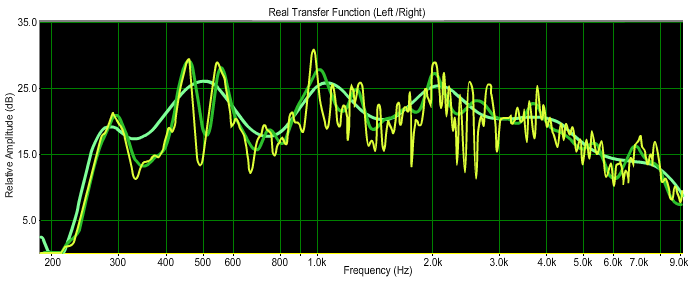
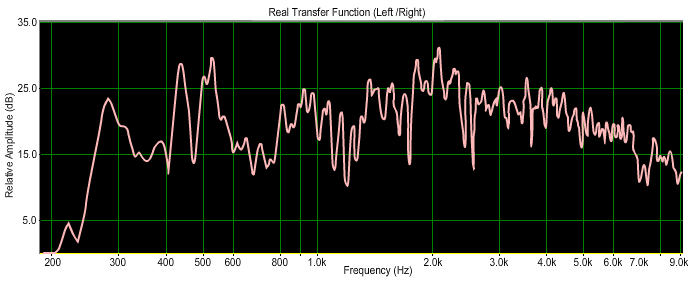
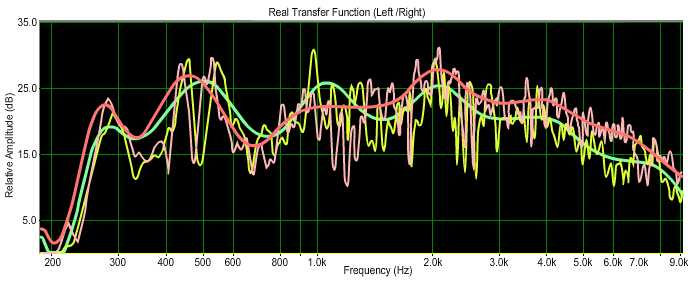
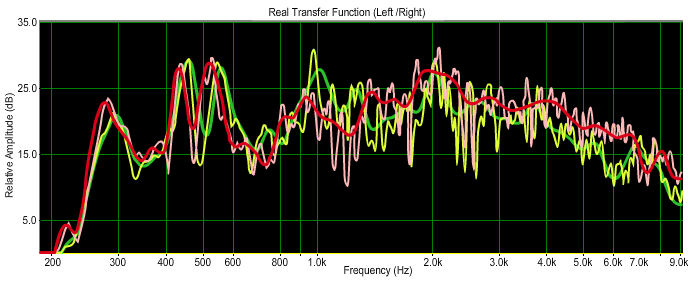
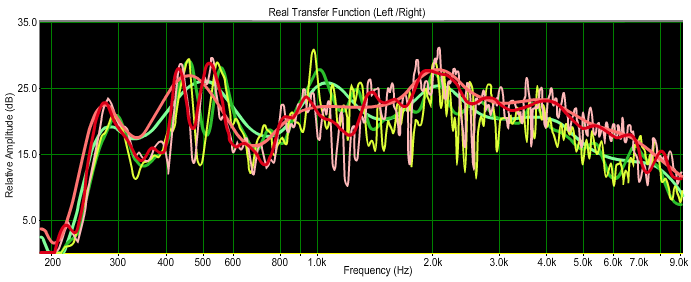
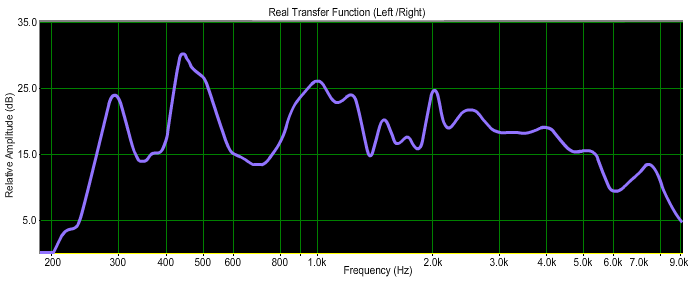
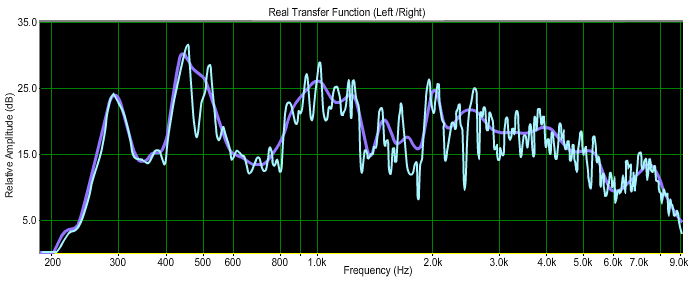
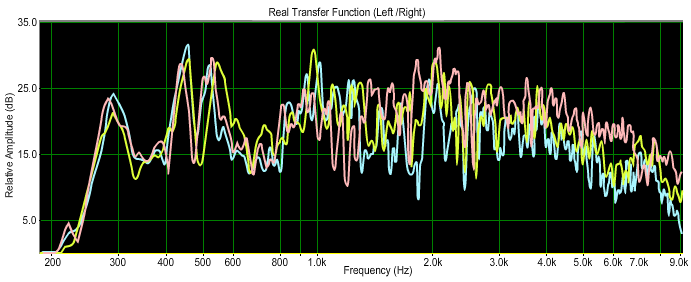
About the Graphs: The recorded sound samples were analyzed with a computer program, and the processed results displayed as a "Spectrum", a graph which visually indicates the amount of sound "radiated" at each frequency . Frequencies are displayed progressively higher from left to right, and Amplitude is displayed progressively stronger from bottom to top.
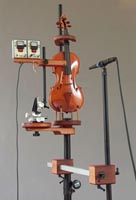
Impact Hammer Tests: Each violin was suspended in a holding apparatus, and the sound was generated using a tiny "impact hammer", which lightly tapped the bass corner of the bridge in a direction parallel with the plane of the top plate. This activates all the resonances of the instrument.
- See Musical Note Equivalents to convert Hertz numbers to musical pitch.
- See Measuring Violin Sound for more about sound analysis, and the Impact Hammer.
- See Get Files to download these sample raw WAV files, for further analysis.
The measurement file for each violin consists of twelve individual bridge-tap readings, each recorded at a particular microphone position surrounding the violin The first position is directly in front of the bridge. For each successive one, the violin is rotated to the left by 30 degrees, (i.e.; over the post, then treble f-hole, treble rib, and so forth, with tap number six directly facing the back,) so that the twelve readings are equally spaced around the instrument. (See About the Sound-Test WAV Files below).
Using the "Bridge-Tap" Sound Player: Can a bridge tap really capture a violin resonance profile? Check the box next to the violin name to play the recorded series of bridge taps made with the impact hammer. While obviously unlike a played violin, one can easily hear differences between violins, and even the sound variation from different positions on the violin, with tap #7 at the back noticeably quieter than tap #1 facing the front. The entire series of 12 taps were averaged and analyzed for this display.
About the Sound-Test WAV Files: Included in GET FILES are three stereo WAV files derived from sound radiation measurements of the Plowden, Titian, and Willemotte violins. Generated using an uncalibrated version of Joseph Curtin's test apparatus, these files are not presented as fully accurate. However they are workable impact hammer measurements for study purposes.
- These test recordings are stereo .wav files. The left channel of each .wav file is the microphone signal, and the right channel is the hammer signal.
- The hammer tapped the bass corner of the bridge in a direction parallel with the plane of the top plate.
- The cardioid microphone was positioned 37 cm from the central axis of the instrument, here defined as a line rising vertically through the endpin.
- There are twelve individual readings in each file. Each is the complex average of four individual measurements taken at the same microphone position. This averaging reduces random noise.