Modal Viewer


Band Averages
This is a way to look at a lot of modal data very quickly. Use the scrolling bar, or select a frequency band from the pull down menu. The examples here are in frequency increments of 10 hz or 50 hz. While the details of single modes may be blurred in band averaging, looking at areas of broader activity may be a more practical guide to selective interventions. In practice any changes to a violin will affect multiple modes. More
Air Animations
Much of the low frequency vibrations, which give depth to a violin’s sound, are radiated from the air inside the violin pumping in and out of the F-holes, essential for the lower frequency. These unprecedented animations by George Bissinger actually show these air flows for the signature modes. The instrument shown is an unnamed test violin. More
Signature Modes Selected Animations with Bending
These animations, which appear with text in Signature Mode Shapes, show the basic mode shapes for the Jackson Strad. Most tellingly, these show not only maximum movement but also areas of maximum bending, perhaps more important to the behavior of the mode, and a clue for possible interventions. These animations have the mobility (movement) shown in deflections of the grid. The areas of maximum bending are shown in colors, with blue and red in bending in opposite phase. Here, the cross-wise, length-wise and twisting bending are displayed separately, for clarity. See Bending Maps: George Stoppani (Strad3D 2009)
Band-Average Images
While much attention has been given to the Signature Modes, the higher frequency modes above 1000 hz are as important to the sound, but much harder to track. As we examine modal activity above 2 kHz it becomes increasingly difficult to extract individual modes with confidence. Rather than focus on individual modes here, we can view average modal activity in a broader range, to indicate areas of general activity, which contribute to the overall response envelope, and the perceived timbre.
Some of the band-average sequences shown here indicate not only displacement and movement (left panel), but also indicate cross-grain bending areas (right panel). Areas of high bending could be even more effective than areas of high displacement in influencing modal behavior. For more about Bending Maps, see Bending Maps.
There are examples from four violins: the Jackson Strad, the Sloane del Gesu, a Carlo Bergonzi and an exceptionally Very Bad Violin. The Jackson Strad has a detailed sound with plenty of sizzle, the Guarneri a more massive dark sound, while the Bergonzi is exceptionally deep and smooth.
The Very Bad Violin is an older factory instrument – This one has no depth at all, sounding thin and scratchy. The bridge admittance suggests that the B1- and B1+ modes have a response level not far behind the old Italians. The explanation of the poor sound is probably that the B1s are at about c and d on the a string while there is very little support below that and though energy is going into the bridge it is not resulting in large volume change. The main peak is in the 1 kHz region while there is a big dip between 2 and 3 kHz … just what we don’t want.
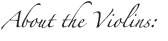
Below is an overlay of bridge mobility for all four violins.
Jackson Strad: green
Sloane del Gesu: blue
Bergonzi: yellow
Very bad violin: red
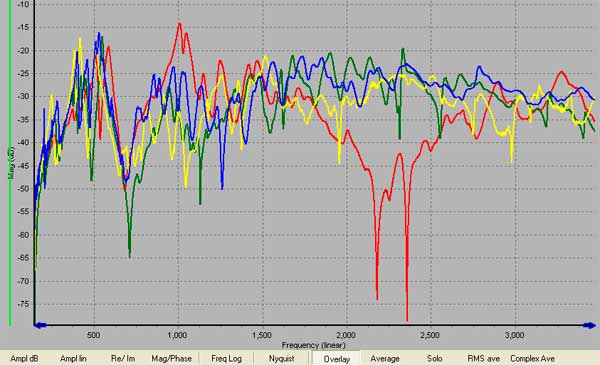
Looking at just 200 to 700 Hz range we can see that the bad violin has the highest B1 frequencies and the Bergonzi the lowest whereas the Sloane del Gesu has a high CBR and the bad violin almost none at all.
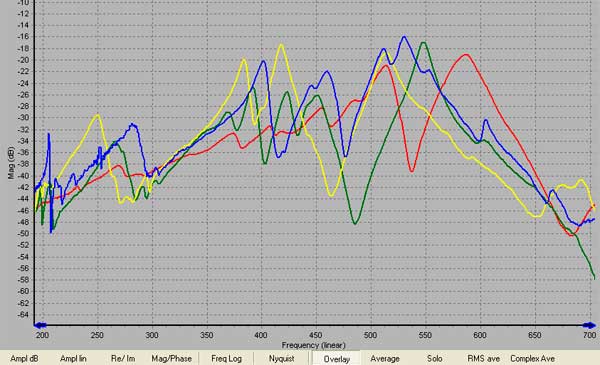
More revealing is an overlay of the RMS averaged corpus mobilities. We now see that energy that went into the bridge has not been well transferred around the corpus of the bad violin.
NOTES ON THE IMAGES:
All the images show magnitude (areas of maximum displacement) There are two sets of images each for the Jackson Strad, Sloan Guarneri DG and Carlo Bergonzi
200-2000 in 10 Hz steps
These narrow band averages probably correspond well with the ODS (operating deflection shape) of the signature modes and others, including information about phase.
1000-3500 or1000 –5000 in 50 Hz steps
These broader bands are useful to indicate areas of higher frequency mode activity. Due to higher modal complexity, phase information can’t be displayed.
Strad vs Guarneri.
The Jackson Strad (left) compared to Sloane del Gesu (right) 200 to 2000 Hz in 10 Hz steps with phase information. One can see that very similar mode shapes appear though at slightly different frequencies. All violins are more alike in the lower frequency range and more different in the higher.
Jackson Strad Mobility (left) and Cross-grain Bending (right)
While maximum movement (mobility) is most obvious to track, tracking areas of maximum Bending is probably more indicative for selective interventions. Sometimes these areas correspond well, but sometimes the differences are striking.
Very Bad Violin
The signature modes look normal but are all at unusually high frequencies because the plates are very thick though heavy with low arching. The shapes have large areas in the same phase even at quite high frequencies which one might guess would be good for radiation.
Air Animations
VIOCADEAS composite violin surface – f-hole air motions animations
These first-ever composite animations of a violin’s corpus signature modes and f-hole air motions were taken from separate zero-mass-loading laser surface mobility scans and f-hole “patch” nearfield acoustical holography (pNAH) measurements (Violin f-hole contribution to far-field radiation via patch Nearfield Acoustical Holography, G. Bissinger, E.B. Williams, N.Valdivia, J. Acoust. Soc. Am. 121, 3899–3906 (2007)), using impact hammer strikes at the bridge to excite violin motions. Some quite new insights into how a violin radiates came from these pNAH measurements when they were combined with farfield measurements over a sphere in an anechoic chamber:
- Directivity – the violin’s radiation from just the f-holes is more directional than from the violin as a whole, leading to more sound from the violin top hemisphere relative to the back. This is an especially helpful at low frequencies where the violin would normally tend to radiate pretty much uniformly in all directions.
- Fraction of radiation from the f-holes exceeds 50% for the 1st corpus bending modes B1- and B1+. This surprising result comes via the large corpus volume changes associated with the B1 modes.
- Driving A0. These B1-driven large airflows through the f-holes are also capable of exciting A0, the low-lying cavity mode so essential to violin sound on the low strings, even though A0 is significantly below the B1 frequencies. (This behavior is analogous to that of a ported loudspeaker system where speaker movements effectively change the box volume, forcing air motions in the port. As the speaker output drops at low frequencies the port - which has its resonance tuned below the speaker falloff frequency – then boosts the total output above the speaker alone.) Experimental VIOCADEAS results show that A0 is stronger when the B1 modes are closer in frequency.
- Falloff with frequency – the f-hole contribution to the overall radiation falls off as frequency increases (a simple extended trendline drops to ~10% at 4 kHz).
- Complex air motion - Above about 700 Hz the bulk compression region is no longer valid and simple phase-antiphase f-hole air motions no longer hold. As an example the strong f-hole radiator at 1080 Hz is presented.
INFORMATIONAL MATERIAL
Signature modes in the open-string, 196-660 Hz region are crucial to violin sound; they are seen in modal analysis results for every violin irrespective of quality:
- Cavity modes A0 and A1: A0 (fA0 ≈ 280 Hz), always the lowest frequency strongly radiating mode, is characterized as Helmholtz-like; A1, the 1st longitudinal mode with frequency fA1 ≈ 1.7 x fA0 ≈ 480 Hz is only sometimes an important radiator, however A1 is coupled to A0, strongly affecting A0 volume dependence.
- Corpus modes CBR, B1- and B1+ - the lowest frequency corpus modes: CBR near 400 Hz, has shear-like in-plane relative motion between top and back plates, a ‡ out-of-plane nodal line pattern on top and back plates, out-of-phase f-hole volume flows and thus relatively weak corpus and f-hole radiation; the 1st corpus bending modes B1- and B1+ both radiate strongly from the surface and through the f-holes.
The pNAH experiment used a linear microphone array to scan a few mm above the surface over the f-hole and immediately surrounding top plate surface. The resulting 108 closely spaced readings of the nearfield radiativity (pressure divided by the exciting force) were then analyzed using mathematical NAH procedures to extract the volume flows at the f-holes and adjacent surfaces at frequencies up to 2.6 kHz. The f-hole air motions represented here take radiativity readings directly along the middle of the f-hole, with phases relative to corpus surface motions taken from pNAH analysis of the entire scan. The animations were adjusted so that the surface mobility and f-hole radiativity magnitudes were nominally the same to clarify how surface and f-hole air motions relate for each mode.
George Bissinger, April 2009