Measuring Violin Response, or Spectra
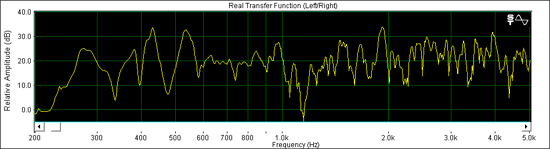
Before isolating single modes, we want to know which modes are most active. Spectral analysis is a way to display the relative frequency and amplitude and of a recorded sound or vibration sample. In this display, loudness increases from bottom to top, and frequency or pitch increases from left to right.
Every resonance peak on a violin is caused by a specific pattern of vibration, called a vibration Mode. While very many vibration modes contribute to a violin’s sound, the first few lower-pitched modes are similar in all violins, are relatively easy to track, and can give a general indication of the instrument’s overall stiffness, and are sometimes called.
There are other modes above this that are seen on most violins though the frequency can vary a lot and the shapes may look somewhat different
Jackson Strad resonance spectra.
In this display, loudness increases from bottom ^ top, and
frequency or pitch increases from left > right
For more about spectra, see Sound Analysis-Spectra, and Measuring Violin Sound by Joseph Curtin
*Note; In the spectrum graphs here, amplitude is plotted on the vertical scale using a decibel (db) scale, which is logarithmic and roughly mimics our sense of loudness. Frequency, (or vibration cycles per second) is what we would hear as musical pitch, and is measured in Hertz (Hz) and plotted on the horizontal axis, again using a logarithmic scale, so that each octave is given equal space.